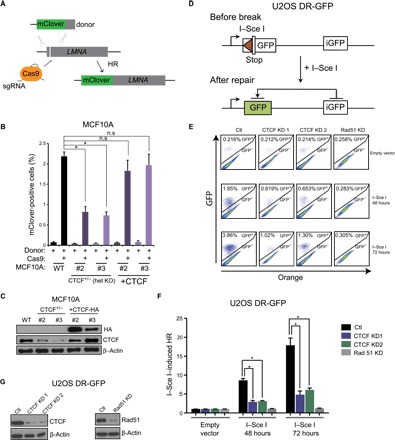
Fig. 4. CTCF regulates HR at I–Sce I– and CRISPR/Cas9-directed double-strand breaks.

(A) Schematic representing the CRISPR-mClover assay for quantification of gene targeting by HR. (B) Quantification of mClover-positive MCF10A control or CTCF+/− cells by flow cytometry, representing the gene targeting efficiency at the LMNA locus. mClover expression was also quantified in CTCF add-back cells (+CTCF). Data are means ± SEM (n = 3; *P ≤ 0.05, one-way ANOVA). (C) Western blotting of CTCF for cells used in mClover experiments described in (B). (D) Schematic representing the DR-GFP assay for measuring gene targeting at I–Sce I cut sites by HR. (E) U2OS DR-GFP HR reporter cells were infected with control, CTCF, or RAD51 shRNAs and transfected with I–Sce I or an empty vector for 48 or 72 hours. The resultant cells were subjected to flow cytometric analysis for GFP-positive cells. (F) Quantification of data from experiment described in (A) depicted by bar graphs. Error bars correspond to means ± SEM (n = 3; *P ≤ 0.05, two-tailed Student’s t test) (G) Western blot for CTCF and Rad51 expression in cells used for experiments described in (E).
