
Fig. 1. Genomic landscapes in southern capuchino seedeaters.
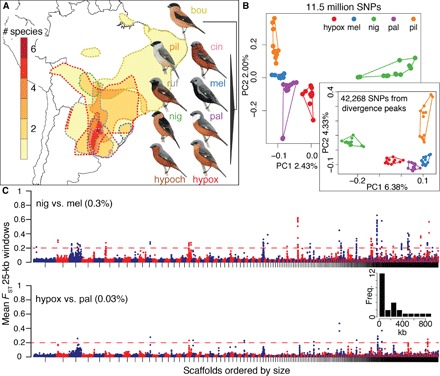
(A) Map indicating the extent of range overlap in the nine species; note that up to six species breed sympatrically in northeastern Argentina. The range of each species is outlined by dashed lines, with colors matching species names. The schematic phylogeny was obtained from Campagna et al. (see text for name abbreviations) (14, 15). (B) PCA including 56 individuals of five species genotyped at ~11.5 million SNPs and a second PCA (60 individuals) using SNPs from divergence peaks alone. Four outlier individuals were omitted from the first PCA (see fig. S1 and Materials and Methods for details). (C) Manhattan plots for nig versus mel (top) and hypox versus pal (bottom); 12 individuals per species. Each circle indicates the mean FST value for all the SNPs within a nonoverlapping 25-kb window. Scaffolds in the reference genome were sorted by decreasing size and are indicated by alternating colors. The threshold for calling divergent windows is indicated by the dashed red line, and the percentage of total elevated windows is noted next to each comparison. The inset is a histogram showing the width distribution (in kilobases) for the 25 divergence peaks we identified.