
Fig. 2. Repeated selection on pigmentation genes in different capuchino species.
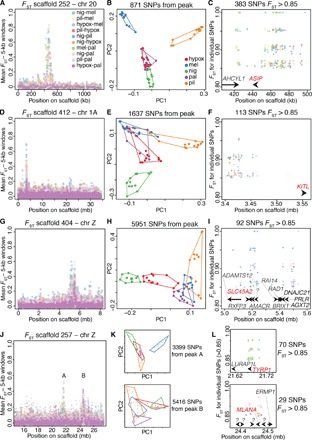
(A) Divergence peak on scaffold 252, which mapped to chromosome 20 in the zebra finch. The 10 possible pairwise comparisons across five capuchino species are overlaid (see color-coded legend to identify specific comparisons). Each circle is the mean FST value for all SNPs within a nonoverlapping 5-kb window. (B) PCA for 60 individuals of five species using the SNPs from under the peak in (A); see the legend to identify species. (C) FST and genomic location of individual SNPs with values of 0.85 and higher, color-coded by pairwise comparison as in (A). The positions of genes that are close to these highly divergent SNPs are indicated by arrows drawn to scale. Names in red note genes involved in the melanogenesis pathway. (D to F) As above, for the divergence peak on scaffold 412. (G to I) As above, for the divergence peak on scaffold 404. (J to L) As above, for the divergence peak on scaffold 257. (K and L) The top plot corresponds to the peak labeled “A” and the bottom one to the peak labeled “B” in (J). Annotations with question marks did not match known genes.