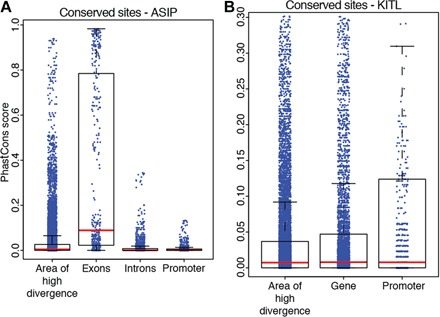
Fig. 4. Conserved genomic regions across multiple bird species.

(A) PhastCons scores in regions close to ASIP. The y axis represents the probability of a nucleotide being conserved in a multigenome alignment of the budgerigar, zebra finch, chicken, and turkey genomes. For the promoter, we used a 1-kb region upstream of the gene. The area of high divergence is shown in Fig. 2C. (B) Same as in (A) for KIT ligand (KITL). In this case, the gene model did not contain intron and exon boundaries.
