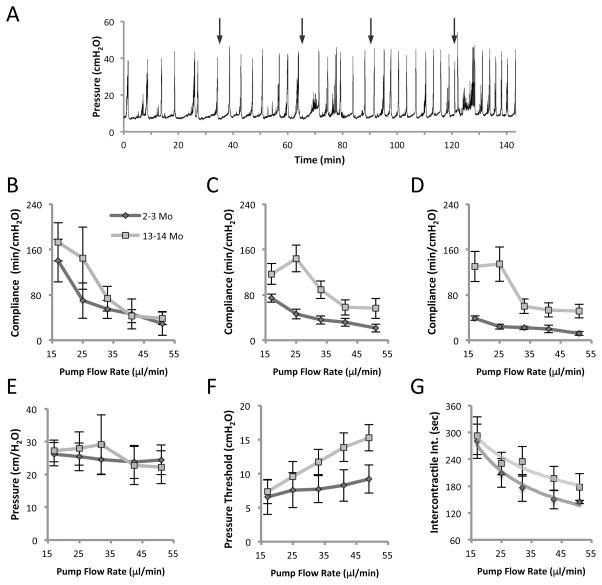
Figure 3. Cystometric parameters of 2–3 and 13–14 months old C57BL/6J males at incremental filling rates of 17, 25, 33, 41 and 49 μl/min.
A. Pressure tracing of a 4 month old mouse. Arrows indicate the time points at which the flow rate was increased. It can be seen that voiding intervals diminish with fill rate. This effect is most pronounced at the slowest filling velocity. B–D. Effect of bladder filling rate on compliance during early third (B), middle third (C) and final third (D) of bladder filling phase. E. Pressure amplitudes at voiding (peak pressure to basal) in younger and older mice. F. Micturition pressure threshold at different flow rates in younger and older mice. G. Intercontractile interval (time between voids) at different filling rates. Both age groups showed a non-linear reduction in ICI with increasing filling rate best described by a power curve (R2 > 0.93). Data is mean ± SEM, N = 4 mice/group. For each flow rate a minimum of 4 voiding cycles was analyzed and a mean calculated.

