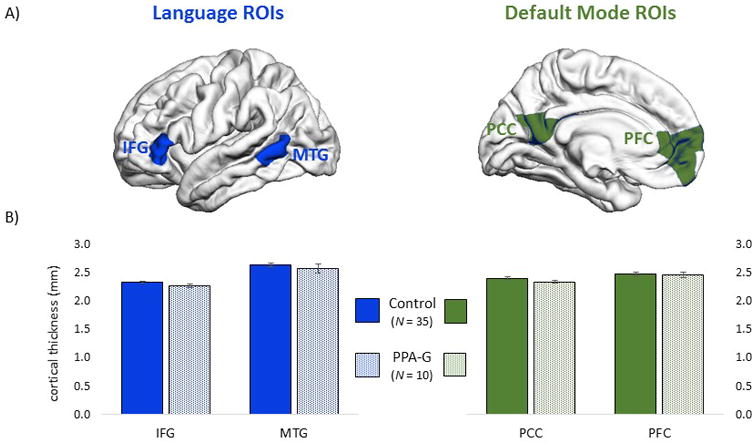
Figure 1. Cortical thickness.

(A) Surface vertex-based ROIs used to evaluate cortical thickness in structural MRI scans. Thickness was evaluated in two language ROIs (IFG and MTG) and two ROIs in the default mode network (PCC and PFC). (B) Average cortical thickness values (with standard error bars) did not differ between groups, in either the language or default mode networks (P > .05).
