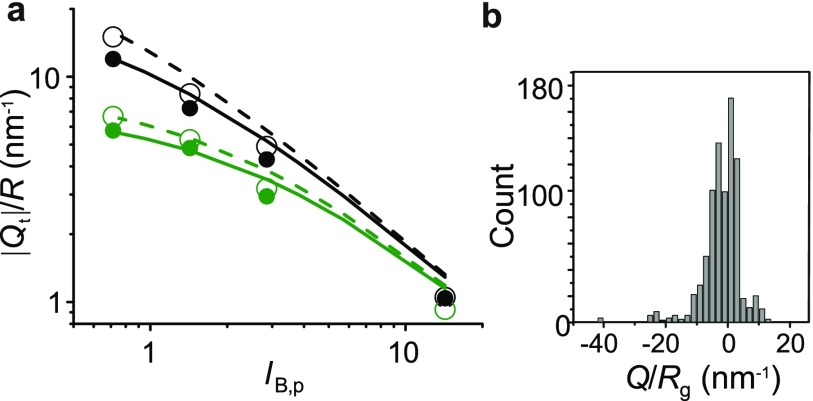
FIG. 2.
(a) Comparison of the numerically calculated and analytically determined threshold charge, corresponding to at which the onset of charge regulation occurs in a spherical charge distribution of radius, R, with . Symbols denote calculations and lines denote the result of Eq. (5). Color denotes different salt concentrations: mM (black) and mM (green). Open symbols and dashed lines denote R = 5.1 nm, while closed symbols and solid lines represent R = 2.55 nm. (b) Histogram of values for globular monomeric proteins, where denotes the calculated radius of gyration of each molecule based on its atomic structure.

