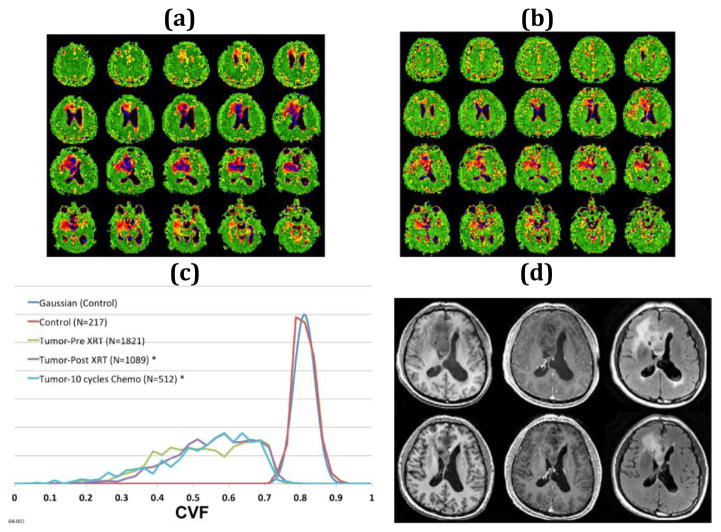
Figure 1.
54-year old right-handed male with an inoperable grade II oligoastrocytoma in the right frontal lobe treated with fractionated radiation therapy (6 weeks 30 fractions, 60 Gy) and 10 cycles of temazolamide chemotherapy. Multiple axial partitions from the 3D CVF maps before (a) and after (b) chemoradiation treatment showing the decrease in volume of the heterogeneous right frontal mass. Normal brain is green (CVF = 0.81). CSF is black (CVF = 0.0). Tumor CVF varies between 0.3 and 0.75. (c) Histograms normalized to the same area for presentation of CVF within the region of tumor before (green line) and after (purple line) fractionated radiation therapy and after 10 cycles of chemotherapy (blue line) with ROIs drawn automatically at threshold of CVF = 0.75 showing little change in the shape of the CVF distribution but marked decrease in volume from 228 ml to 136 ml to 64 ml, respectively, at end of each treatment. The control region (red) is from a control region in the contralateral parietal lobe and shows a mean CVF of 0.81. The color scale for CVF extends from 0 (black) to 1 (green). (d) 1H axial images before (top row) and post (bottom row) radiation with pre-gadolinium T1-weighted (left) post-gadolinium T1-weighted (middle) and T2-weighted FLAIR images (right) show the poorly defined non-enhancing mass in the right frontal lobe that decreased in volume with treatment. The changes were monitored weekly and changes were progressive decrease in volume as the tumor margins reverted to normal CVF indicating killing of infiltrating tumor.

