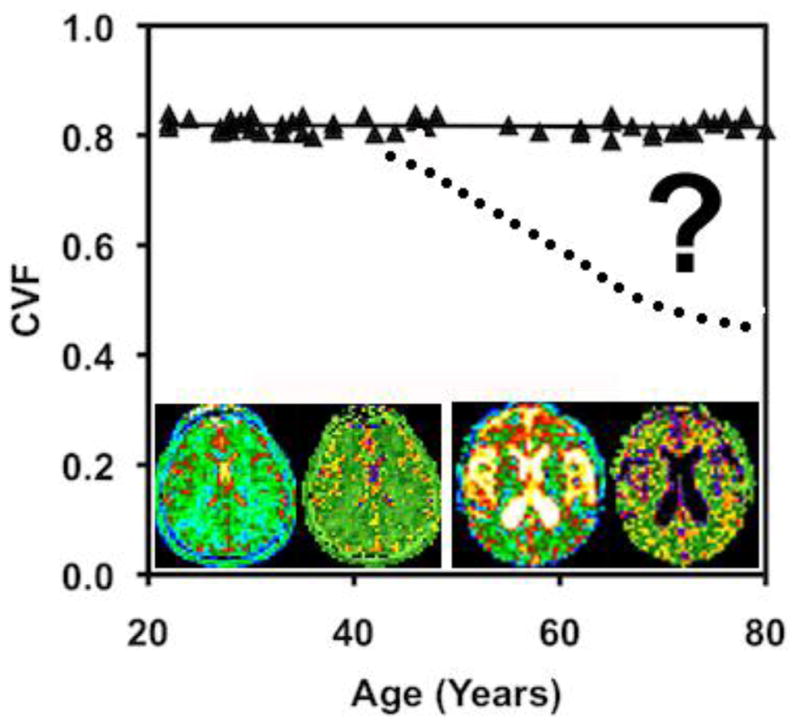
Figure 2.

CVF as a function of age in cognitively normal adults. Image inserts of a young adult (left pair) and elderly adult (right pair), each with the TSC (left) and CVF (right) bioscales. The elderly subject shows the expected increased CSF spaces (white on TSC and black on CVF maps) but the brain parenchyma has the same TSC and CVF in both subjects (green color). The question remains to be answered as to when subjects with neurodegenerative disease (dotted line) deviate from the normal function.
