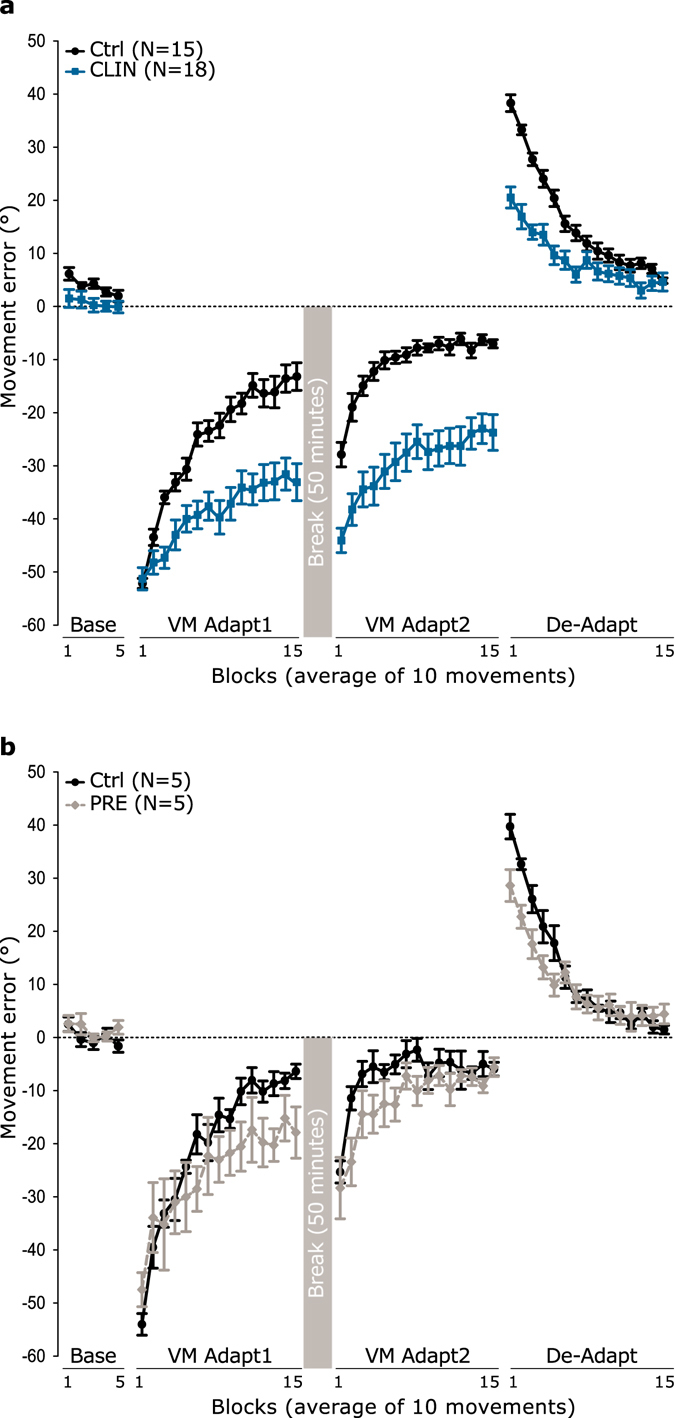
Figure 3.

Movement error in baseline, adaptation and de-adaptation phases for the CLIN patients (a) and the PRE individuals (b). Movement error in degrees is represented in blocks of 10 trials throughout the different experimental phases: baseline, visuomotor adaptation 1 and 2 (VM Adapt1 and VM Adapt2) and de-adaptation (De-Adapt) for the CLIN patients (blue squares and lines), the PRE individuals (grey diamonds and dashed lines) and their respective control groups (Ctrl: black disks and lines). The 50-minutes break is represented by a grey square between VM Adapt1 and VM Adapt2. Negative (positive) errors correspond to anti-clockwise (clockwise) deviation relative to the target. Error bars are standard errors of the mean.
