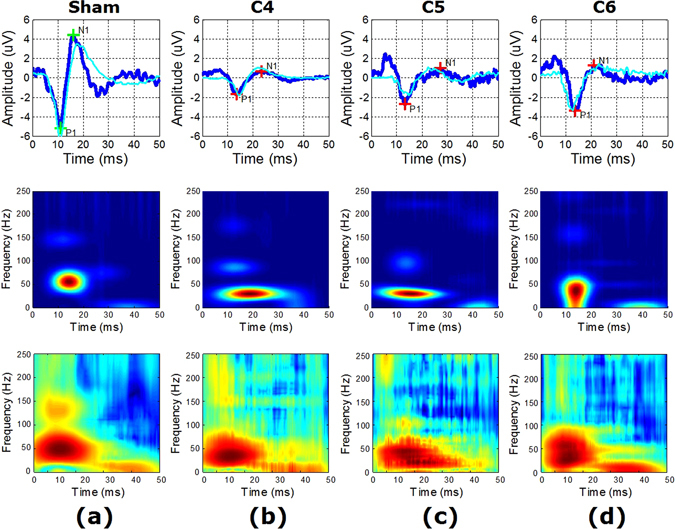
Figure 4.

Example (from four representative animals) and averaged (over all animals for each condition) SEP waveforms and time-frequency distributions. Columns (conditions): (a) normal, (b) injury at C4, (c) injury at C5, (d) injury at C6. First row: SEP waveform (blue) from an example animal for each condition with P1-N1 peaks marked as green (normal) and red (injury) crosses, and SEP waveform (cyan) averaged over all animals for each condition. Second row: MP-based time-frequency distribution corresponding to the example waveform in the first column. Third row: MP-based time-frequency distribution averaged over all animals for each condition corresponding to the averaged waveform in the first column.
