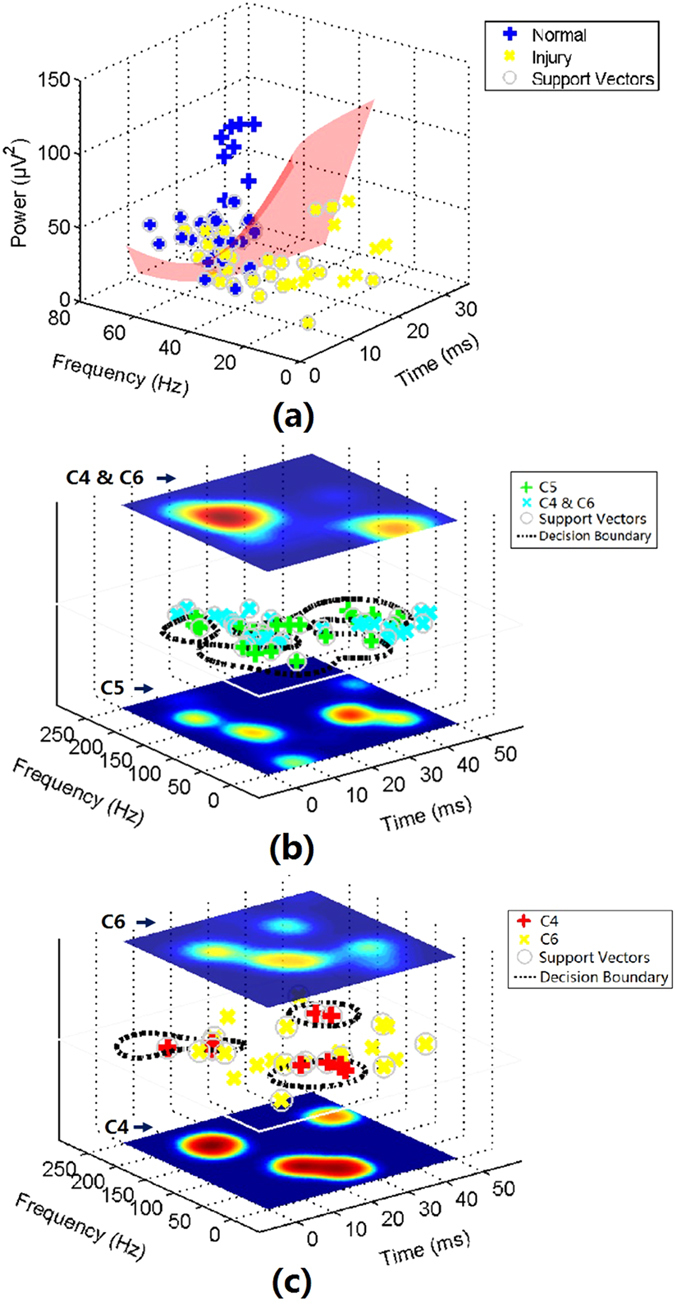
Figure 5.

Distributions of high-energy, middle-energy, and low-energy TFCs and illustrations of SVM-based classification. (a) Distribution of high-energy TFCs in the time-frequency-power space. Red surface indicates the decision boundary of Classifier I for differentiating between normal group TFCs and injury group TFCs; (b) Distribution of middle-energy TFCs of the three injury groups in the time-frequency domain (center plane). Dashed curves indicate the decision boundaries of Classifier II for differentiating between C5 group TFCs and C4&C6 group TFCs. PDFs of TFCs from these two classes are shown in the bottom (C5) and top (C4&C6) plane; (c) Distribution of low-energy TFCs of the three injury groups in the time-frequency domain (center plane). Dashed curves indicate the decision boundaries of Classifier II for differentiating between C4 group TFCs and C6 group TFCs. PDFs of TFCs from these two classes are shown in the bottom (C4) and top (C6) plane.
