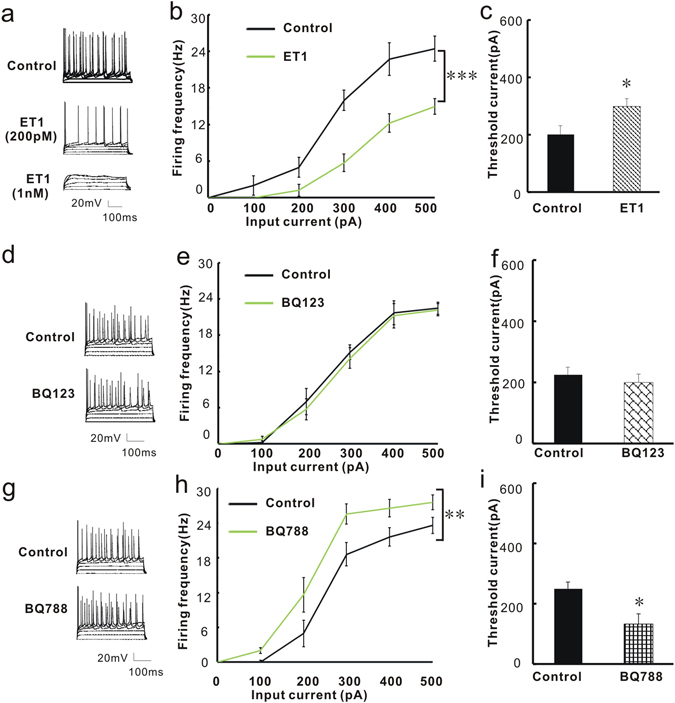
Figure 4.

The firing frequency and threshold current of action potential generation are regulated by ET1 and ETBR antagonists. (a) Voltage responses of a representative pyramidal neuron in the BLA to current injections of, from bottom to top, 0, 100, 200, 300, 400, and 500 pA. Different concentrations of ET1 solution were applied. (b) Summary plot of the firing frequency before and after application of 200 pM ET1 (n = 8/group). (c) Summary histogram of the threshold current for action potential before and after application of 200 pM ET1 (n = 8/group). (d) Voltage response of a representative pyramidal neuron in the BLA to current injections of, from bottom to top, 0 to 500 pA, before and after BQ123 treatment. (e) Summary plot of the firing frequency before and after application of 1 nm BQ123 (n = 8/group). (f) Summary histogram of the threshold current for action potential before and after application of 1 nm BQ123 (n = 8/group). (g) Voltage response of a representative pyramidal neuron in the BLA to current injections of, from bottom to top, 0 to 500 pA, before and after BQ788 treatment. (h) Summary plot of the firing frequency before and after application of 2 nM BQ788 (n = 6/group). (i) Summary histogram of the threshold current before and after application of 2 nM BQ788 (n = 6/group). *P < 0.05, two-way ANOVA test with one factor as repeated measure for 4b, 4e and 4 h and Student’s t test for 4c, 4f and 4i.
