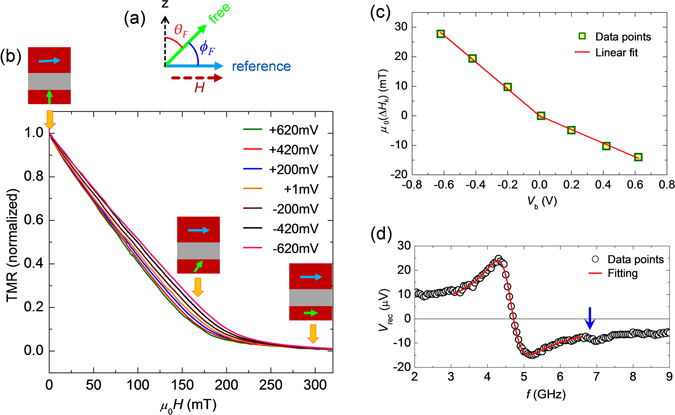
Figure 2.

PMA versus voltage and typical rectified voltage signal in linear regime. (a) Schematic diagram for the geometry of free & reference layer magnetizations and bias magnetic field. (b) Normalized TMR as a function of µ 0 H for different values of V b. The schematic diagrams show the alignment of magnetizations for free and reference layers. (c) Variation of change in µ 0 H k with V b. Solid lines correspond to the linear fitting to find out the slope. (d) Typical plot of V rec as a function of f measured at P rf = 5 µW. Solid line represents the fitted curve with Eq. 1.
