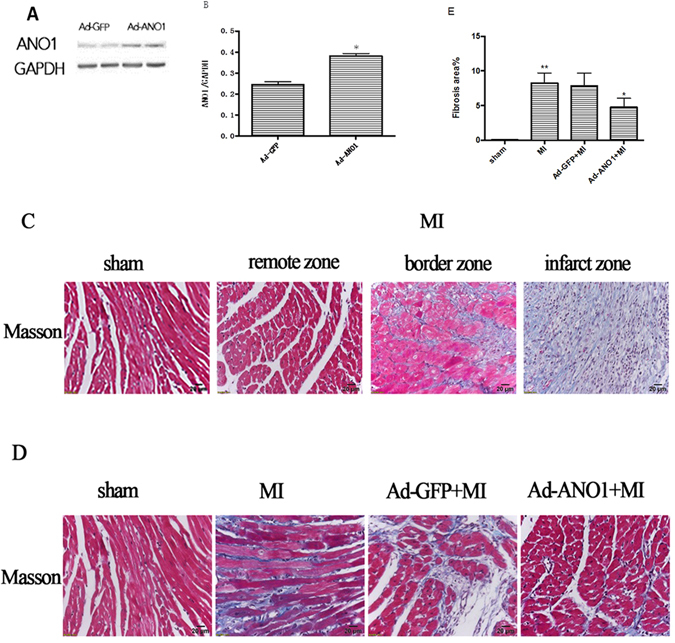
Figure 5.

Overexpression of ANO1 attenuates cardiac fibrosis post-MI. (A)Western blot of ANO1 expression levels in Ad-ANO1+MI and Ad-GFP+MI group. The blots of GAPDH serves as loading controls. (B) Quantitative analysis of ANO1. (C) Representative Masson’s trichrome staining in sham group and remote zone, border zone, infarct zone of MI group. Blue staining indicates connective tissue. Scale bars represent 20 μm. (D) Representative Masson’s trichrome staining in sham, MI, Ad-ANO1+MI and Ad-GFP+MI. Scale bars represent 20 μm. (E) The quantification of fibrosis. *P < 0.05 versus MI or Ad-GFP+MI.**P < 0.01 versus sham. n = 6 per group.
