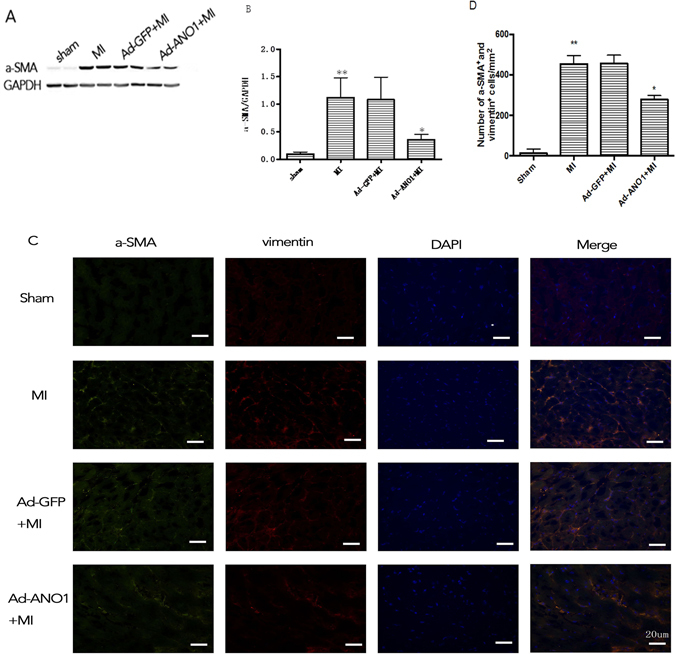
Figure 6.

ANO1 inhibited myofibroblast differentiation in vivo. (A) Western blot of a-SMA protein expression. GAPDH was used as loading controls. (B) Quantitative analysis of a-SMA. (C)Representative immunofluorescence image of a-SMA and vimentin, green, a-SMA; red,vimentin; blue, nuclei. Scale bars represent 20 μm. (D) The quantification of number of a-SMA and vimentin positivestaining cells per mm2. *p < 0.05 versus MI or Ad-GFP+MI,**p < 0.01 versus sham (n = 6).
