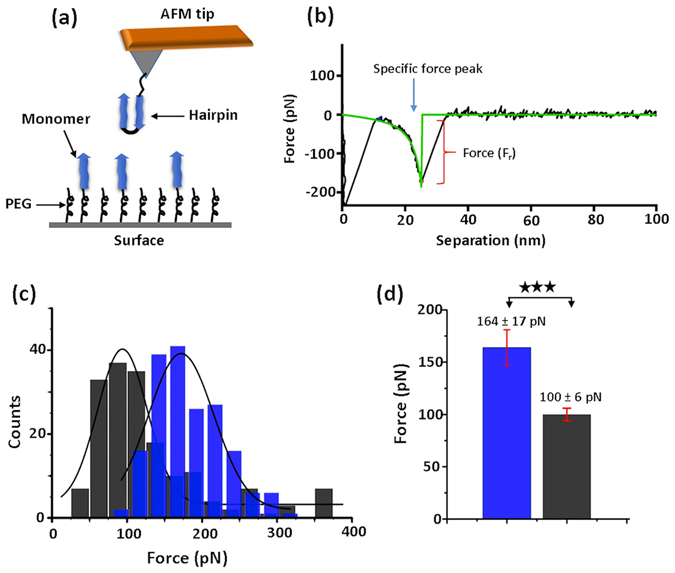
Figure 3.

AFM force measurement; (a) Schematic of force spectroscopy setup for H-M assembly. (b) A typical force-distance (F-D) curve; the specific unbinding fingerprint is highlighted with an arrow. The green line indicates worm-like-chain (WLC) fitting that estimate the rupture force (Fr). (c) Force histograms for H-M (n = 180, blue) and H-H (n = 175, dark grey) complexes; black lines indicate Gaussian fitting. (d) Bar diagram showing the mean rupture force for H-M (blue) and H-H (grey) assemblies from three independent experiments. Asterisks indicate statistical significance between the two groups using Kolmogorov-Smirnov test (***p < 0.005). The experimental conditions were as follows: retraction speed, 500 nm/s; buffer, 10 mM sodium phosphate buffer (pH 7.0); room temperature. n is the number of data points.
