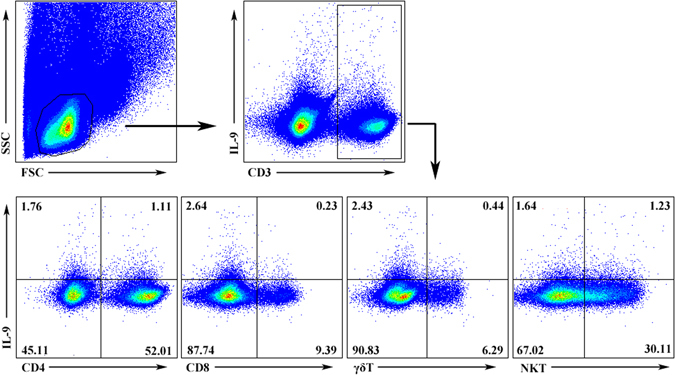
Figure 4.

IL-9 expression of different T cell subsets in infected hepatic lymphocytes. Female C57BL/6 mice were infected with 40 ± 5 S. japonicum cercariae per mouse. These mice were sacrificed at 5–6 weeks post infection. Single hepatic lymphocyte suspensions were stimulated for 5 hours with PMA and ionomycin supplemented with BFA. Cells were stained with different fluorophore-conjugated antibodies for CD3, CD4, CD8, γδTCR, NK1.1 and IL-9 for FACS analysis. Numbers in quadrants are percentages of cells in each expression phenotype. A representative of three independent experiments is shown.
