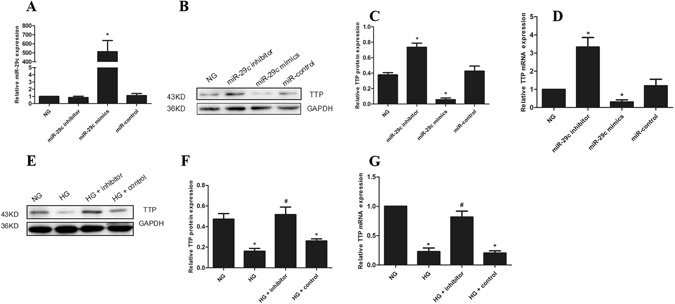
Figure 6.

miRNA-29c targets TTP. (A) The expression of miRNA-29c in podocytes transfected with mimics (30 nM) or inhibitors (100 nM) for 6 h. (B) Western blot analysis showed the expression of TTP in podocytes transfected with mimics or inhibitors for 36 h. (C) The quantified Western blot data shown in graph format. (D) qRT-PCR analysis of TTP mRNA expression in podocytes transfected with mimics or inhibitors. (E) Podocytes were transfected with miRNA-29c inhibitor (100 nM) and treated with HG (25 mM) for 36 h as compared with NG. (F) The quantified Western blot data shown in graph format. (G) qRT-PCR analysis of TTP mRNA expression in podocytes transfected with miRNA-29c inhibitors (100 nM) and treated with HG (25 mM) for 24 h. Results were obtained from three independent experiments. The data are shown as mean ± SEM. *P < 0.05 compared with control. # P < 0.05 compared with high glucose.
