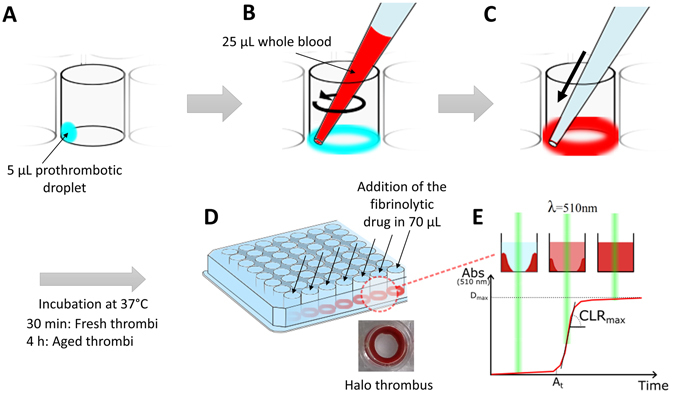
Figure 1.

Schematic illustration of the halo assay protocol. (A) Droplets of the clotting mixture (Innovin + CaCl2) are deposited on the bottom edge of the wells of a 96 well plate. (B) The clotting mixture is spread around the edge of the wells with the tip of a P100 micropipette containing 25 μL of blood. (C) The blood is slowly released and mixed around the edge of the well thereby making use of the fluidic cohesion effect. (D) After incubation at 37 °C for 30 minutes (fresh clots) or 4 hours (aged clots), the clots should have a homogenous halo shape at the bottom of the wells, leaving the centre area of the well clear and empty. (E) The fibrinolytic drugs to be tested are added with a multichannel pipette and the degradation of the halo clots measured straight after with a plate reader at 510 nm from the absorbance of the blood starting to progressively cover the centre of the well. Several parameters are determined on the obtained fibrinolysis profiles; the maximum degradation (Dmax), the activation time (At) and the maximum clot lysis rate (CLRmax).
