
Figure 2.
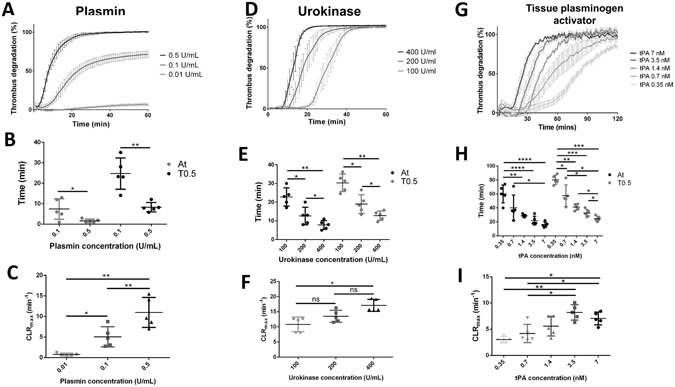
Thrombolysis study with plasmin, urokinase and tissue plasminogen activator (t-PA). Thrombolysis profiles measured with the Halo assay method with 0.5 U/mL, 0.1 U/mL and 0.01 U/mL plasmin (A), with 400 U/mL, 200 U/mL and 100 U/mL urokinase (D) and with 0.35 nM, 0.7 nM, 1.4 nM, 3.5 nM and 7 nM t-PA (G). Activation times (At, black spots) and time to 50% lysis (T0.5, grey spots) (B,E and H) and maximal clot lysis rates (C,F and I) were presented for each concentration as mean values ± SD (n = 5, ns: not significant, *p < 0.05, **p < 0.01, ***p < 0.001, ****p < 0.0001).