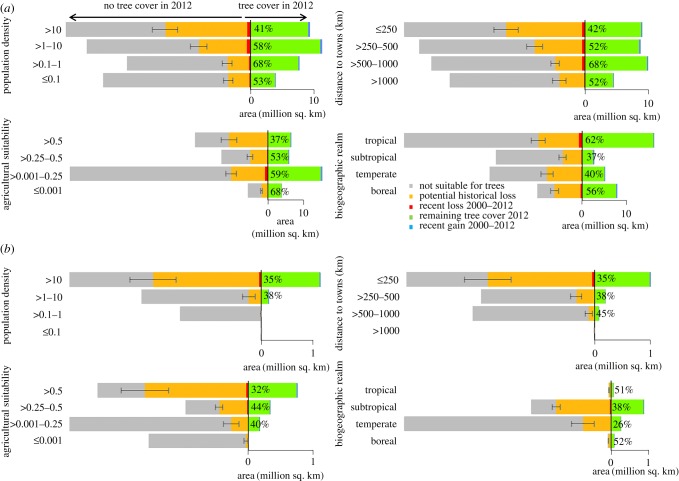
Figure 3.
Tree cover changes globally (a) and in China (b). The analysis is restricted to tree cover with minimum 50% crown cover. The percentages show total remaining tree cover in 2012 (mean modelled remaining tree cover + recent gains), and the error bars indicate the range of predictions of the tree cover suitability models (see electronic supplementary material, Methods S4). For detailed figures of recent tree cover losses, see the electronic supplementary material, figures S4 and S9, and for associated maps see electronic supplementary material, figure S10.

