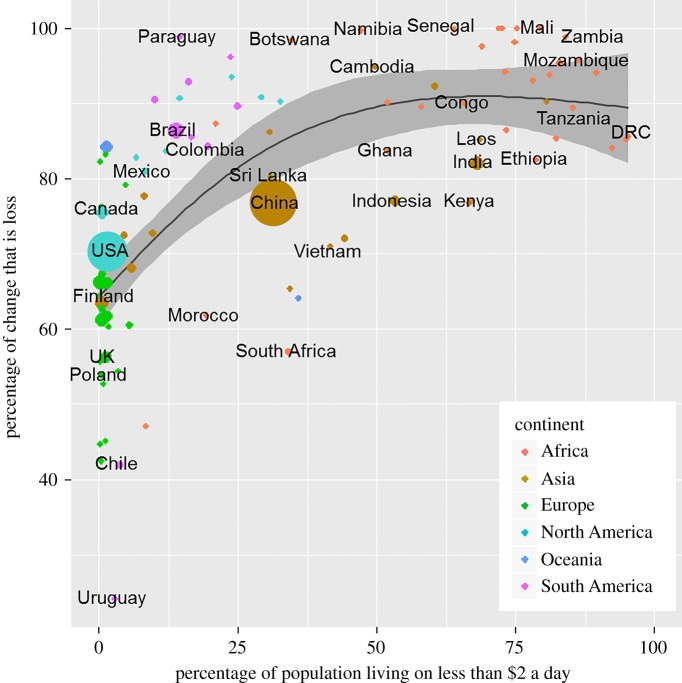
Figure 6.
Proportionate net tree cover loss by country against poverty. The size of the plotting symbols is proportionate to the absolute increase in GDP between 2000 and 2012. The trend line is based on natural cubic splines (F = 42; d.f. = 97; R2 = 0.5; p ≤ 0.001) and the grey shading shows the 95% confidence intervals. The analysis is restricted to countries with a minimum of 10 000 km2 tree cover in 2000. Exemplar countries are listed. Proportionate net tree cover loss = loss/loss + gain.

