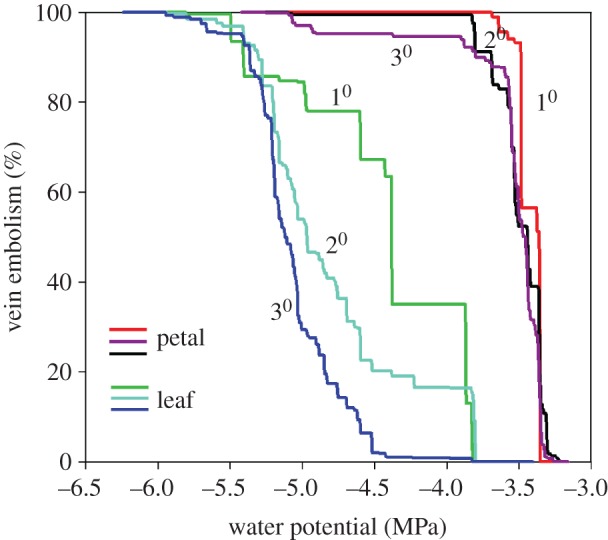
Figure 2.

Cumulative area of cavitated 1st, 2nd and 3rd order veins of an adjacent leaf (green, cyan, blue lines) and petal (red, black and purple lines) of Passiflora tarminiana, expressed as a function of water potential. The resultant accumulation of air embolism is shown as a per cent of the maximum area. Step increases in %embolism indicate large cavitations that propagate among multiple veins.
