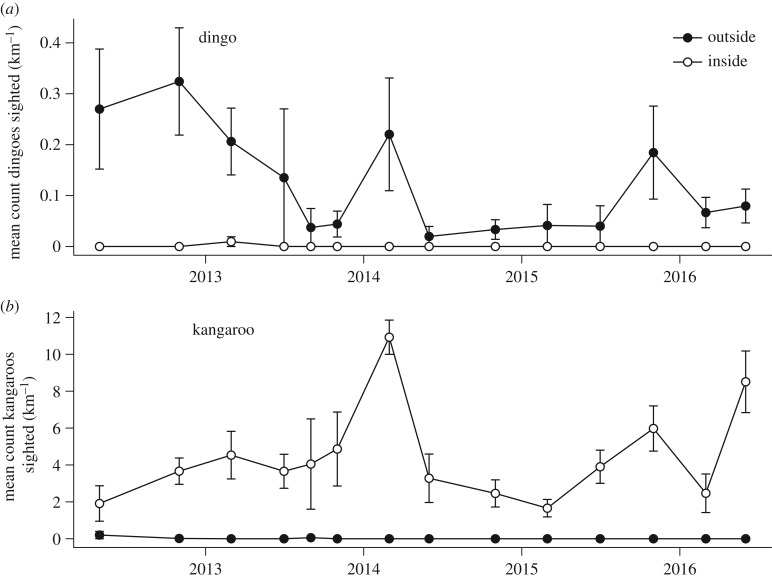
Figure 2.
The abundance of (a) dingoes and (b) kangaroos expressed as the mean number of individuals sighted per kilometre surveyed (±1 s.e.m.) during spotlight surveys conducted on each side of the dingo fence between May 2012 and June 2016. Open symbols indicate sites located inside the dingo fence where dingoes were rare and closed symbols indicate sites located outside the dingo fence where dingoes were common.

