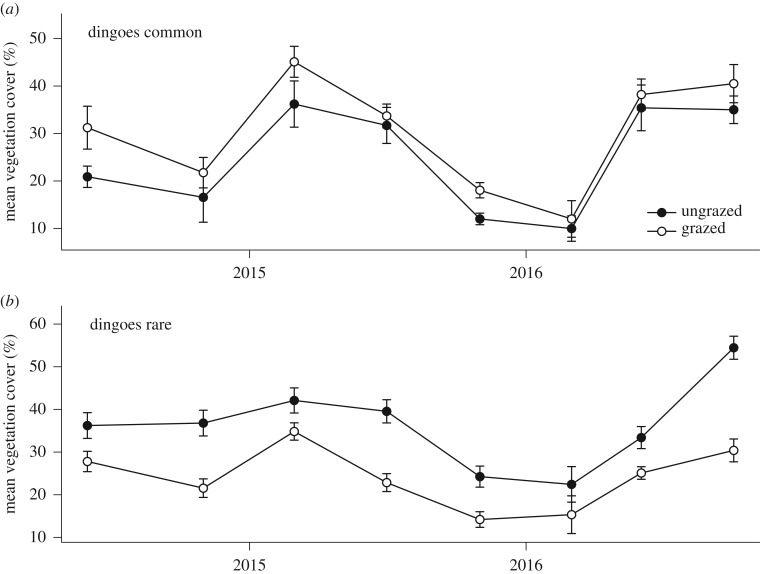
Figure 3.
Mean percentage vegetation cover (±1 s.e.m.) in ‘ungrazed exclosures’ (closed symbols) and grazed control plots (open symbols) located (a) outside the dingo fence where dingoes were common and (b) located inside the fence where dingoes were rare. Data presented are for surveys conducted between June 2014 and October 2016.

