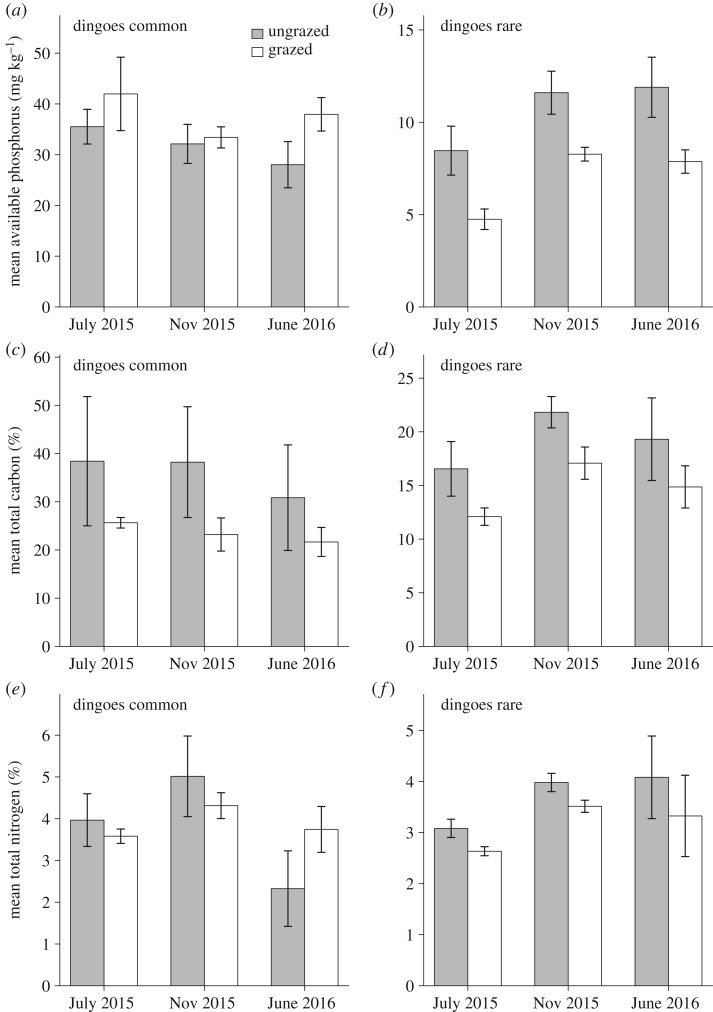
Figure 4.
Mean soil nutrient levels (±1 s.e.m.), in ‘ungrazed exclosure’ plots (grey bars) and grazed control plots (white bars). (a) Mean available phosphorus, by Bray 2 method, in milligrams per mass of soil (mg kg−1), outside the fence where dingoes were common and (b) inside the fence where dingoes were rare. (c) Mean per cent total carbon outside the dingo fence where dingoes were common and (d) inside the fence where dingoes were rare. (e) Mean per cent total nitrogen outside the dingo fence where dingoes were common and (f) inside the fence where dingoes were rare.

