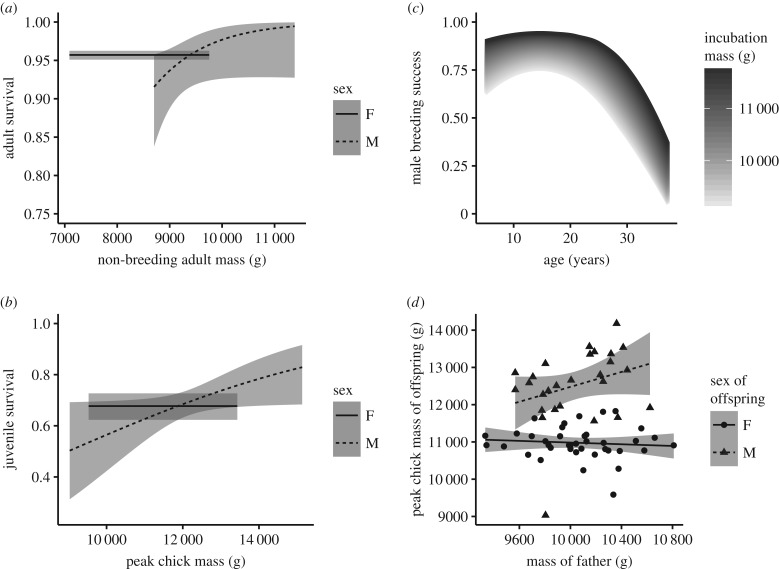
Figure 1.
Effect of mass on life-history traits. Predicted annual male and female survival for (a) adults based on model S1 and for (b) juveniles based on model SJ1. The annual breeding success of males as predicted by the BSM1 is plotted in (c) as function of age and mass. The shade gradient represents the effect of mass; confidence intervals in this case have been omitted to improve readability. Peak chick mass of offspring in relation to the mass of father is depicted in (d). The dots are the observed values and lines the predicted values. The grey ribbons are the 95% CIs (except for c) and have been calculated with the delta method for (a,b).

