Figure 3.
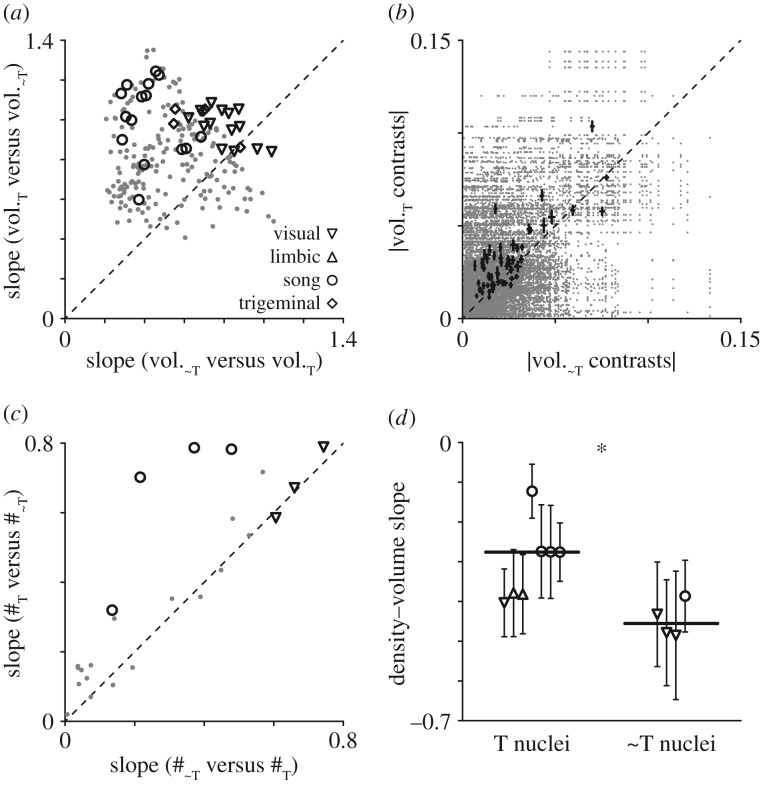
Telencephalic nuclei scale with positive allometry. (a) Allometric slopes from pairwise T versus ∼T nucleus regressions, computed either with a T nucleus as the dependent variable (y-axis) or a ∼T nucleus as the dependent variable (x-axis). The consistently higher slopes in the former arrangement (p = 9.9 × 10⁻²⁷) indicate pervasive telencephalic hyperallometry. Black symbols indicate correlations between nuclei from the same system, grey dots indicate correlations across them. (b) Absolute contrast magnitudes were greater for T than ∼T nuclei (p = 1.3 × 10⁻⁶) at most nodes in the phylogeny. All pairwise comparisons are in grey, means and standard errors for each node are in black. (c) Allometric slopes from regressions between numbers of neurons in T and ∼T nuclei (p = 0.02); layout and symbols are as above. (d) Slopes of nucleus neuron density as a function of volume (±95% CI.) were shallower for T than ∼T nuclei (p = 0.01), suggesting the rate of T hyperallometry is underestimated by structure volumes. Black lines are medians.

