Figure 2.
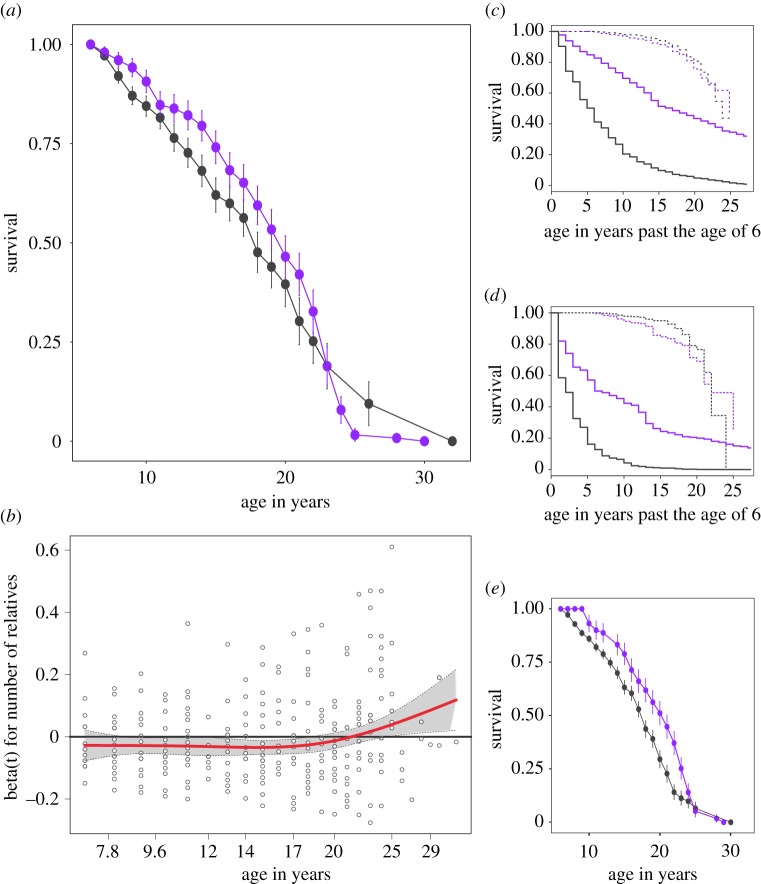
Family network size predicts survival in prime-aged but not older adult females. (a) Relationship between survival and number of adult female relatives across female age generated using raw data, where r ≥ 0.063 and plots are Kaplan–Meier survival estimates with standard error bars. Purple lines are females with greater than or equal to 75% quartile number of adult female relatives, black lines are females with less than 25% quartile number of adult female relatives. (b) The hazard coefficient for the impact of number of relatives on survival (red line) was non-proportional, falling below zero (black line) in early years and above zero later in life. (c) Predictive relationship between survival and number of adult female relatives in an age-dependent context and (d) when matrilineal rank is taken into account. Solid lines are prime-aged females, dashed lines are old females, purple and black lines are the same as in (a). Plots show female survival past the age they enter the dataset (6 years old, thus 1 on the x-axis is equivalent to 7 years of age). (e) Shows the same plot as in (a) but where r = 0.5.

