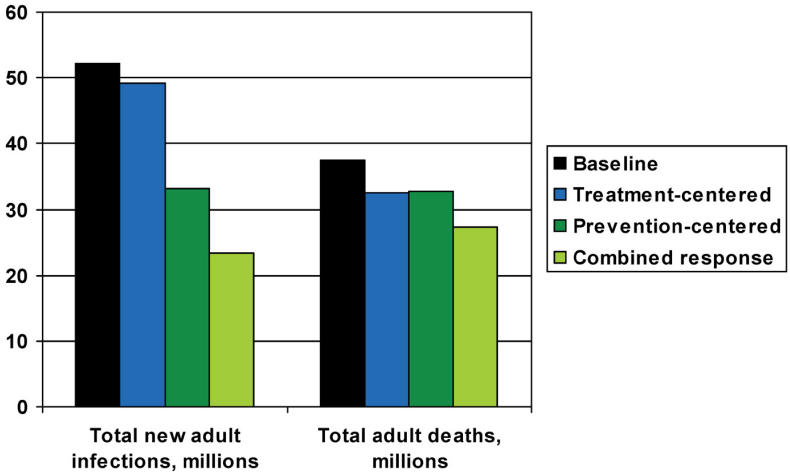
Figure 1. Projected New Adult Infections and Total Adult Deaths, in Millions, to 2020.
This graph represents projections through 2020, and, when there was a choice, highlights the more successful iteration of a model. The treatment-centered response, therefore, shows data from the optimal-effects model, and the combined response data reflect the optimistic model.

