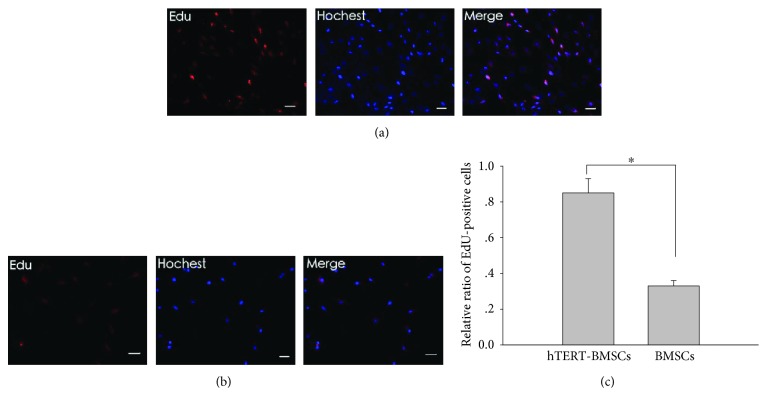
Figure 4.
EdU proliferation assay of the effect of hTERT on the growth of BMSCs. The red fluorescent cells are in the S phase of mitosis, and the blue fluorescent cells represent all cells. (a) and (b) present images of P30 hTERT-BMSCs and P14 BMSCs, respectively. (c) Ratio of EdU-positive cells. Significance level is P < 0.05, indicated by ∗. Scale bar: 100 μm.

