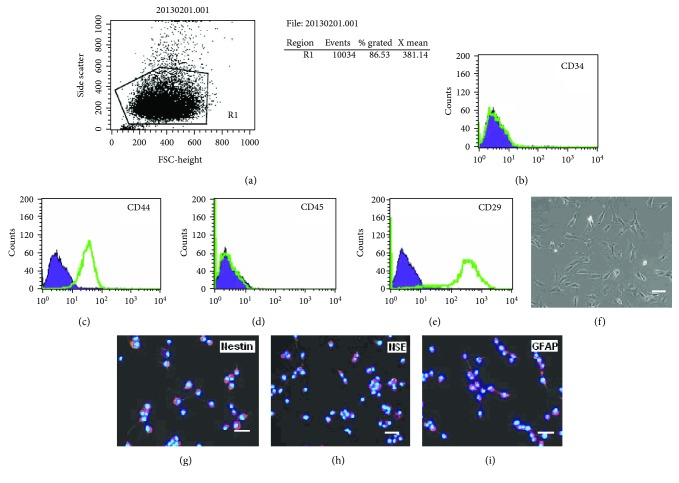
Figure 5.
Identification of surface phenotype and neurogenesis of hTERT-BMSCs. (a–e) Expression of surface molecules detected using flow cytometry analysis. (f) Typical morphology was observed under an inverted phase contrast microscope. (g–i) The expression of neural specific markers on hTERT-immortalized BMSCs (note: nuclei were stained with Hoechst 33342 blue). Scale bar: 100 μm.

