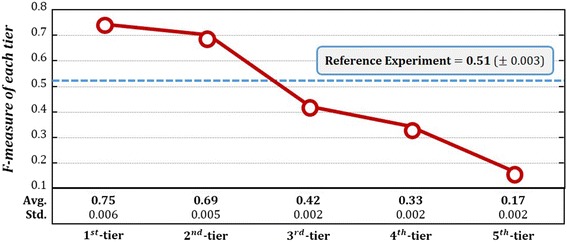
Fig. 6.

F-measure of each tier and entire diseases. The graph shows results of prediction for each tier through candidate drug selection and drug repositioning. The most precise tier has 1st-tier of KL value indicating 0.75 of F-measure performance. On the other hand, 5th-tier which falls on bottom 20% of KL value showed 0.17 that is the lowest accuracy. 5 tiers showed that they become more precise when their level is high. Reference experiment showed 0.51 performance. To summarize, the proposed method is believed to be a meaningful methodology to perform drug repositioning
