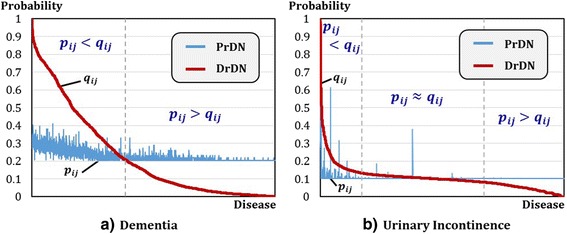
Fig. 7.

Probability Distributions in PrDN and DrDN for Dementia and Urinary Incontinence. The graphs show probability distributions in PrDN and DrDN to calculate KL value in the candidate disease prioritization step. a indicates a graph for dementia while b is a graph for urinary incontinence. Both graphs are lined-up by descending order of probability value. From the two graphs, b urinary incontinence shows a little bit of difference at both ends and almost overlapped interval is lengthy without significant difference. On the contrary, a dementia indicates significant difference without overlapped interval between PrDN and DrDN
