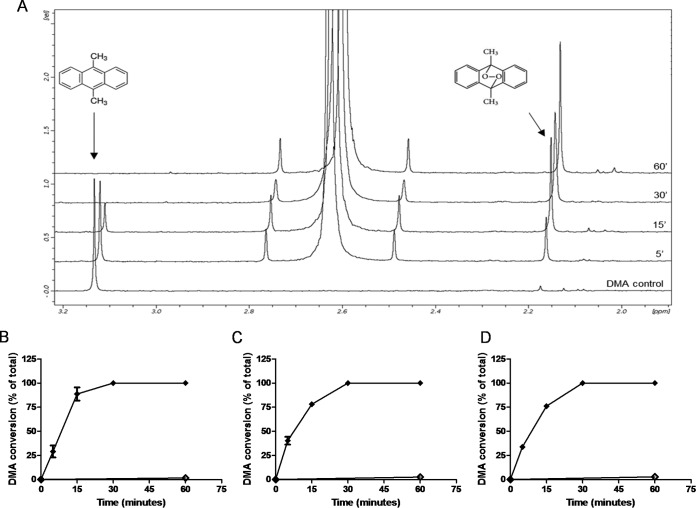
FIG 5.
1O2 formation by photoactivation of porphyrins. (A) DMA/oxi-DMA conversion was evaluated by 1H NMR, comparing the DMA methyl peaks at 3.1 ppm and 2.1 ppm, respectively. PPIX (B), ZnPPIX (C), and MPIX (D) at final concentrations of 0.001 μM, 0.1 μM, and 0.01 μM, respectively, were added to a solution of 20 μM DMA in chloroform and exposed to visible light (provided by a 30-W lamp with luminous emittance of 2,000 lx at a distance of 10 cm) (◆). As controls, the spectra of nonphotoactivated samples (♢) were recorded after 60 min of incubation in the dark. The data represent the means of two independent measurements. rel, relative peak intensity.

