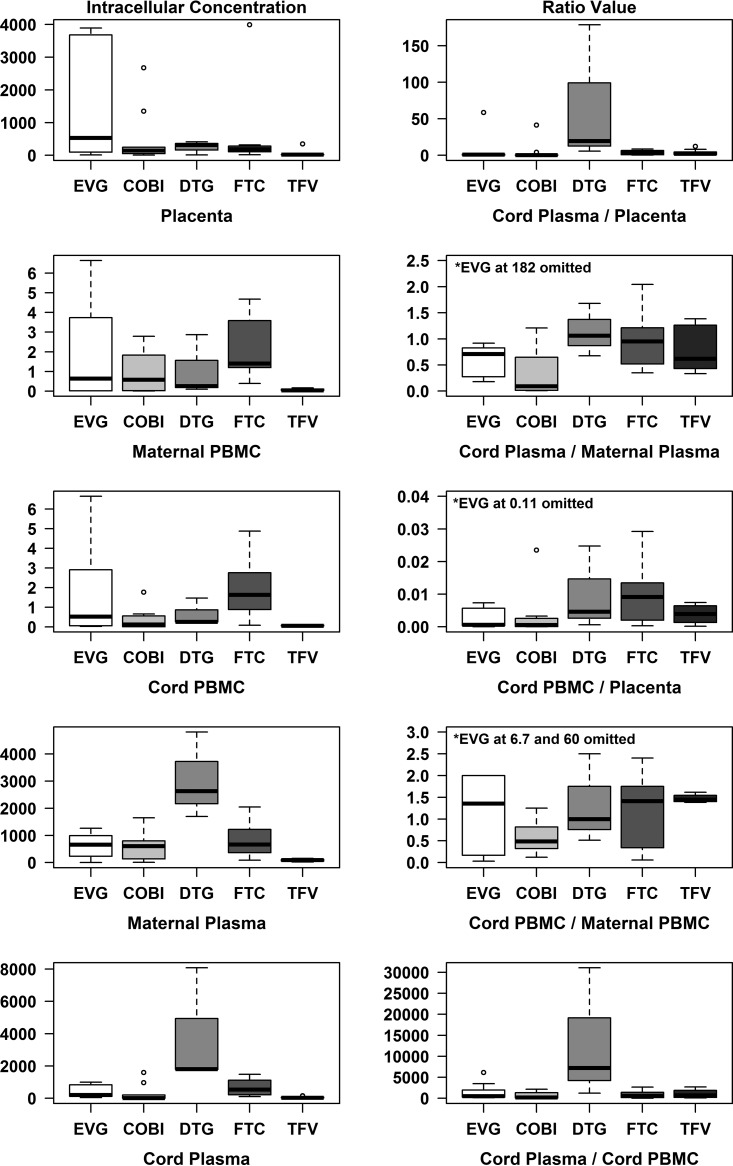
FIG 1.
Statistical significance was evaluated at a P of 0.05 significance level, and data analyses were performed using SAS v9.4 (SAS, Cary, NC) and R v3.3 (R Foundation for Statistical Computing, Vienna, Austria). Concentrations of EVG, DTG, and COBI, as well as FTC and TFV, were summarized using medians and interquartile ranges and minimums and maximums and are visually represented with box plots.

