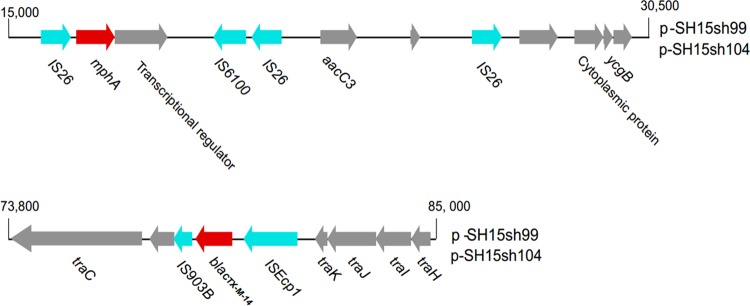
FIG 3.
The mosaic region of pSH15sh99 and pSH15sh104 with the surroundings of mph(A) and blaCTX-M-14. The resistance genes are denoted by arrows and colored based on gene function classification. mph(A) and blaCTX-M-14 are colored in red, IS elements are colored in light blue, and others are in gray.

