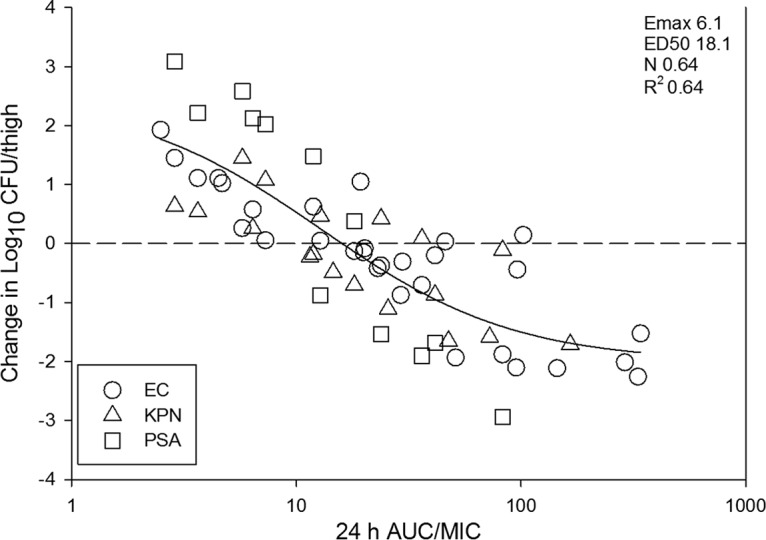
FIG 6.

Relationship between the PD index AUC/MIC ratio and treatment efficacy of fosfomycin against all 10 isolates using a neutropenic mouse thigh model. The horizontal line at 0 represents the burden of organisms in the thighs of mice at the start of therapy. Data points below the line represent killing, and points above the line represent growth. The R2 represents the coefficient of determination. The ED50 represents 50% of the maximal effect (Emax), and N is the slope of the relationship or the Hill coefficient. The line drawn through the data points is the best-fit line based upon the sigmoid Emax formula.
