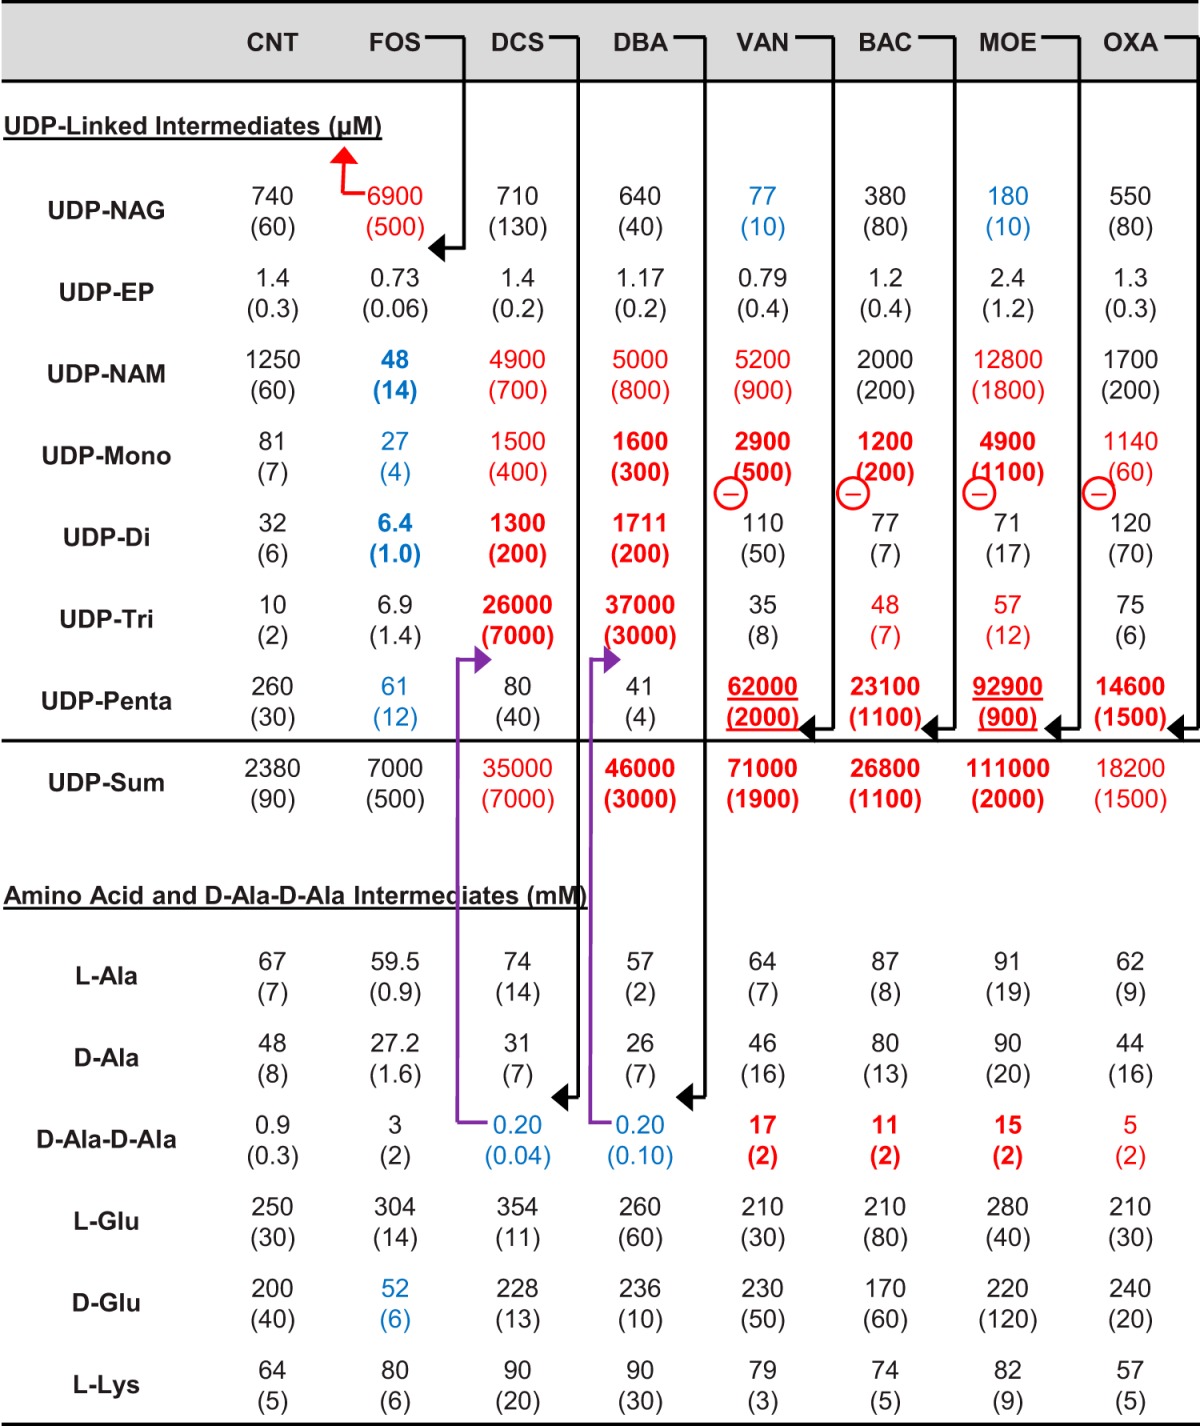
TABLE 1.
Cytoplasmic peptidoglycan biosynthesis intermediate levels in MRSA (ATCC 43300) in control and antibiotic-treated samplesa

Antibiotic treatments were for 90 min at 4× MIC, except for oxacillin which was sub-MIC. The values in parentheses are standard errors (n = 3). Red values denote substantially (3-fold) increased values, blue values denote substantially (3-fold) decreased values, bold values denote strongly (10-fold) affected values, and underlined values denote very strongly (100-fold) affected values. Black arrows denote the primary step targeted by an agent, purple arrows denote a secondary metabolite level effect, and the red arrow denotes a possible negative regulatory effect of accumulating metabolites. Other inferred sites of negative regulation are denoted with a red circled minus symbol. Antibiotic treatment abbreviations: CNT, control; FOS, fosfomycin; DCS, d-cycloserine; DBA, d-boroalanine; VAN, vancomycin; BAC, bacitracin; MOE, moenomycin; OXA, oxacillin.
