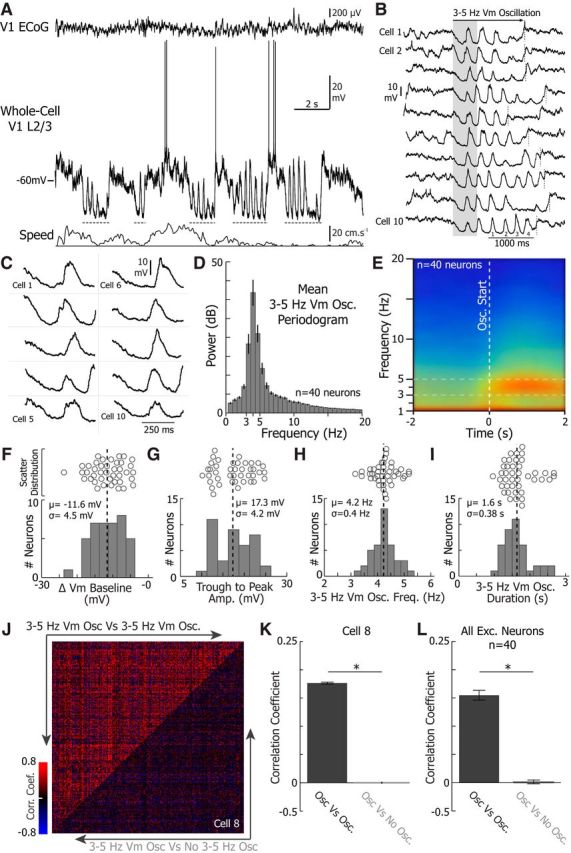
Figure 1.

3–5 Hz Vm oscillations are brief stereotyped events characterized by high amplitude 3–5 Hz fluctuations riding on a hyperpolarized baseline Vm. A, Example whole-cell recording from a V1 layer 2/3 excitatory neuron during wakefulness, simultaneously recorded with the local ECoG (top) placed over V1 and the treadmill motion (locomotion, bottom). Gray dotted lines indicate times when 3–5 Hz oscillations were observed in the neuron's Vm. B, Example 3–5 Hz Vm oscillations from 10 neurons. The beginning and end of the 3–5 Hz Vm oscillations are indicated by the left edge of the shaded box and the dotted vertical line, respectively. The cycles are numbered on cell 10 to demonstrate the frequency of the oscillations. C, Zoom up of the shaded region in B. Note the hyperpolarization and the similar amplitude of the oscillation across all 10 neurons. The mean periodogram (D) and spectrogram (E) during 3–5 Hz Vm oscillations collected from 40 neurons. Histogram of the mean change in Vm baseline (F) and histogram of the mean trough to peak amplitude during 3–5 Hz Vm oscillations (n = 40 neurons) (G). Histogram of the mean oscillation frequency (H) and histogram of the mean oscillation duration (n = 40 neurons) (I). Mean (μ) and SD (σ) are shown on each histogram. Scatter plots above each histogram further illustrate each distribution. J, The Pearson correlation coefficient between each 3–5 Hz Vm oscillation (top left, 3–5 Hz Vm Osc vs 3–5 Hz Vm Osc) and each 3–5 Hz Vm oscillation and a period of equal length 4 s preceding each 3–5 Hz Vm oscillation (bottom right, 3–5 Hz Vm Osc vs No 3–5 Hz Vm Osc) for every oscillation in one neuron (cell 8, n = 289 3–5 Hz Vm oscillations). K, The mean correlation coefficient between each 3–5 Hz Vm oscillation and each 3–5 Hz Vm oscillation compared with the 2 s before a 3–5 Hz Vm oscillation (cell 8, n = 289 3–5 Hz Vm oscillations; WSRT, p < 0.0001). L, The mean correlation coefficient between each 3–5 Hz Vm oscillation and each 3–5 Hz Vm oscillation compared with the 2 s before a 3–5 Hz Vm oscillation averaged across all excitatory neurons (n = 40 neurons; WSRT, p < 0.0001). Error bars indicate SEM. *p < 0.05.
