Figure 7.

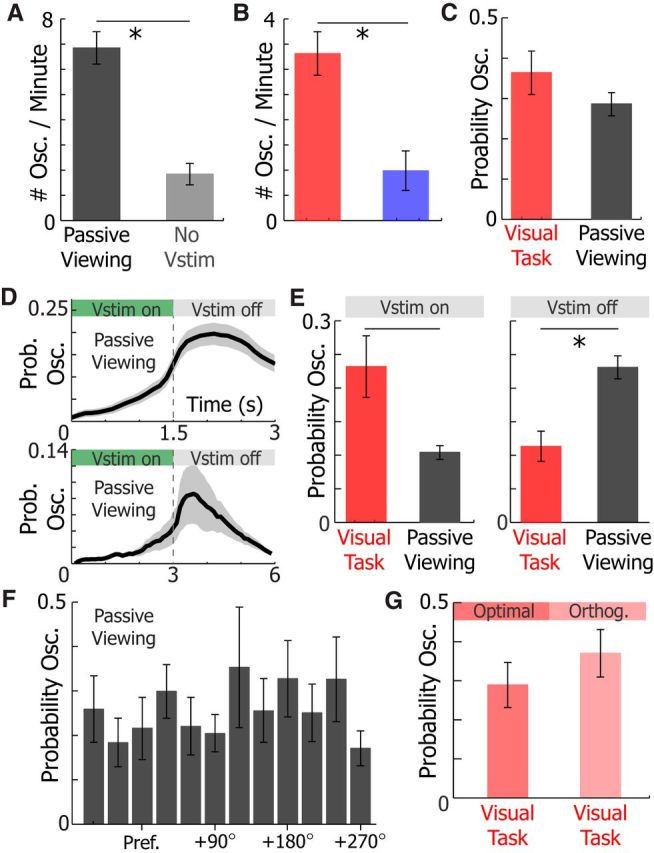
Visual stimulation recruits 3–5 Hz Vm oscillations during passive viewing, but oscillations tend to occur after the visual stimulus during passive viewing. A, The number of oscillations per minute was higher during passive viewing (black) of 1.5 s drifting gratings than 5–10 min periods where no visual stimuli were shown (No vstim, gray; WSRT, p = 1.7e-5). B, The number of oscillations per minute was higher during the visual task (red) than the auditory (blue) discrimination task (WRST, p = 0.008). C, The probability of 3–5 Hz Vm oscillations during a trial was not different during the visual task and passive viewing (WRST, p = 0.26). D, The probability of evoking an oscillation during passive viewing when the visual stimulus is 1.5 s (top, n = 40) or 3 s (bottom, n = 9). E, Comparison of the mean probability of 3–5 Hz Vm oscillations occurring in neurons recorded from animals during the visual task (red, n = 21) and passive viewing (gray, n = 53) while a visual stimulus is on (left, WRST, p = 0.001) and off (right, WRST, p = 0.007). F, The probability of a 3–5 Hz Vm oscillation occurring during passive viewing of visual cues in relation to excitatory neuron (n = 40, one-way ANOVA, p = 0.76) tuning. Pref., Preferred visual stimulus. G, The probability of a 3–5 Hz Vm oscillation occurring during visual discrimination of the optimal or orthogonal visual stimulus (n = 21 neurons, WSRT, p = 0.34). Error bars indicate SEM. *p < 0.05.
