Figure 4.
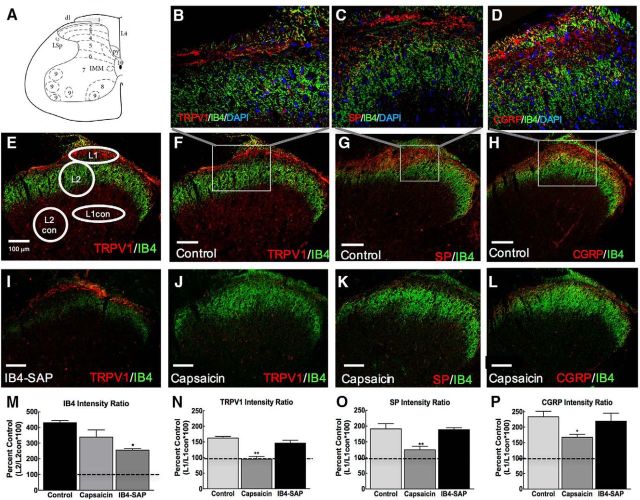
Capsaicin eliminates TRPV1, SP, and CGRP immunofluorescent staining and IB4-SAP diminishes IB4 immunofluorescence in the spinal dorsal horn. A, Spinal map from The Rat Brain in Stereotaxic Coordinates, 4th edition (Paxinos and Watson, 1998). B, Representative 40× image inset from F of DAPI (blue), IB4 (green) conjugate fluorescence, and TRPV1 (red) immunofluorescence indicating a lack of overlap between IB4, TRPV1, and DAPI signal in a control animal. Images were collected using a single optical section. C, Representative 40× image inset from G of DAPI (blue), IB4 (green) conjugate fluorescence, and SP (red) immunofluorescence indicating a lack of overlap between IB4 SP and DAPI signal in a control animal. D, Representative 40× image inset from H of DAPI (blue), IB4 (green) conjugate fluorescence, and CGRP (red) immunofluorescence indicating a lack of overlap between IB4, CGRP, and DAPI signal in a control animal. E, Representative image demonstrating ROIs used for calculation of intensity ratios. For TRPV1, SP, and CGRP, intensity values from an oval ROI targeting a section of lamina 1 (L1) was divided by intensity values from an oval ROI in the deeper lamina L1 control (L1con). For IB4 immunofluorescence, a circle targeting a section of lamina 2 (L2) was divided by L2 control (L2con). This provides a ratio of the target area of interest divided by an internal control. F, Representative 20× image demonstrating TRPV1 (red) and IB4 (green) immunofluorescence in a section from a control rat. G, Representative 20× image demonstrating immunofluorescence for SP (red) and IB4 (green) in a spinal cord section from a control-treated rat. H, Representative 20× image demonstrating immunofluorescence for CGRP (red) and IB4 (green) in a spinal cord section from a control-treated rat. I, Representative image demonstrating immunofluorescence of TRPV1 (red) and reduction of IB4 (green) immunofluorescence. J, Representative image demonstrating lack of TRPV1 (red) immunofluorescence after treatment with capsaicin with IB4 (green) immunofluorescence remaining. K, Representative image demonstrating lack of SP (red) immunofluorescence after treatment with capsaicin with IB4 (green) immunofluorescence remaining. L, Representative image demonstrating absence of CGRP (red) immunofluorescence in capsaicin-treated rats with IB4 (green) immunofluorescence remaining. M, Intensity ratios demonstrating that there is a significant reduction in IB4-binding fibers within the spinal cord of IB4-SAP-treated rats compared with controls. No significant difference was observed in capsaicin-treated rats compared with controls. All dashed lines represent ratio value (100) at which there is equivalent mean gray values for L1/L1con or L2/L2con. Graphs are mean ± SEM. *p < 0.05 versus control, **p < 0.01 versus control. N, Intensity ratios demonstrate that there is a significant reduction in TRPV1 immunofluorescence in capsaicin-treated rats compared with controls. No difference in TRPV1 intensity ratios were observed in IB4-SAP treated rats. O, Intensity ratios demonstrate a significant reduction in SP immunofluorescence compared with control; no difference in SP immunofluorescence is observed in IB4-SAP treated rats compared with controls. P, Intensity ratios demonstrating a significant reduction in CGRP immunofluorescence in capsaicin-treated rats compared with controls, with no significant change in CGRP immunofluorescence in the IB4-SAP-treated rats. Scale bar, 100 μm.

