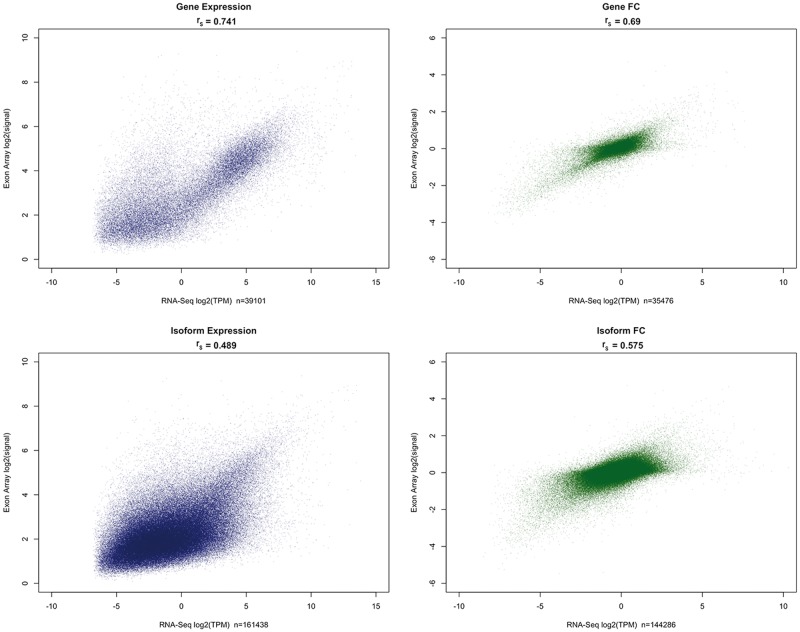
Figure 1.
Scatter plots of average expression and fold change (tumor versus normal) estimates between exon array and RNA-seq at both gene and isoform levels. Normalized expression estimates were averaged across samples for each program. RNA-seq estimates were then averaged across programs. Transcripts that were not resolved by a majority of RNA-seq programs were excluded. Transcripts with an average expression TPMadj < log2(0.001) were considered to be not expressed.

