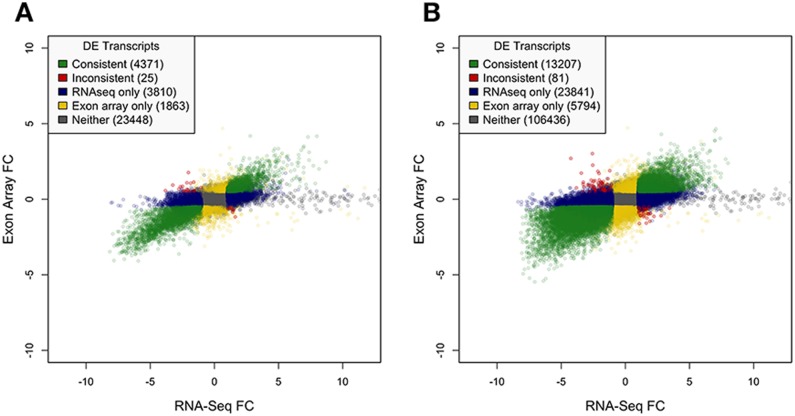
Figure 3.
Scatter plots of fold changes labeled according to differential expression. Average fold changes (tumor versus normal) between exon array and RNA-seq are plotted and labeled according to whether they were identified as DE. Genes/isoforms identified as DE by both platforms with consistent direction of change are plotted in green. Genes/isoforms identified as DE by only RNA-seq or exon array are plotted in blue and yellow, respectively. Genes/isoforms not identified as DE by either platform are plotted in gray. Genes/isoforms identified as DE by both platforms but with inconsistent directions of change are plotted in red. (A) Gene-level DE. (B) Isoform-level DE.

