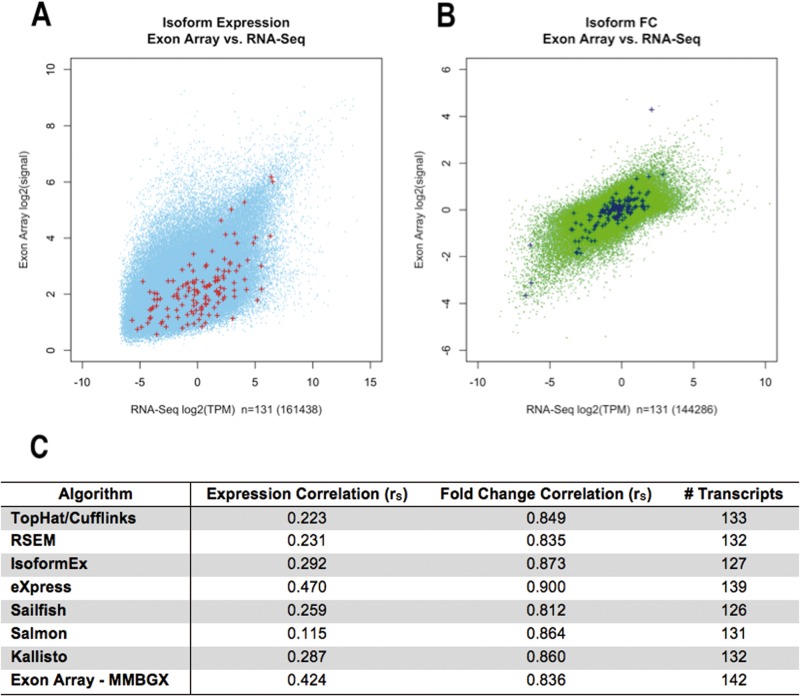
Figure 4.
RT-qPCR correlations. (A) The transcripts included in RT-qPCR analysis, according to their average expression estimates from the RNA-seq and MMBGX exon-array tumor results. (B) The transcripts included in RT-qPCR analysis, according to their average fold change estimates relative to normal brain from the RNA-seq and MMBGX exon-array results. (C) The Spearman correlations and number of shared, resolved transcripts between the various programs tested and the RT-qPCR estimates.

