
Table 1.
Correlations between RNA-seq abundance estimates
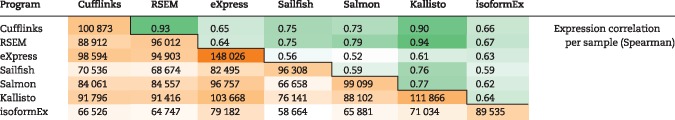 |
Number of overlapping resolved isoforms per sample.
Expression estimates from each of the tested RNA-seq quantification methods were compared with one another. The number of resolved transcripts shared between each pair of methods is shown in the lower-left. The Spearman correlation between each pair of methods is shown in the upper right.