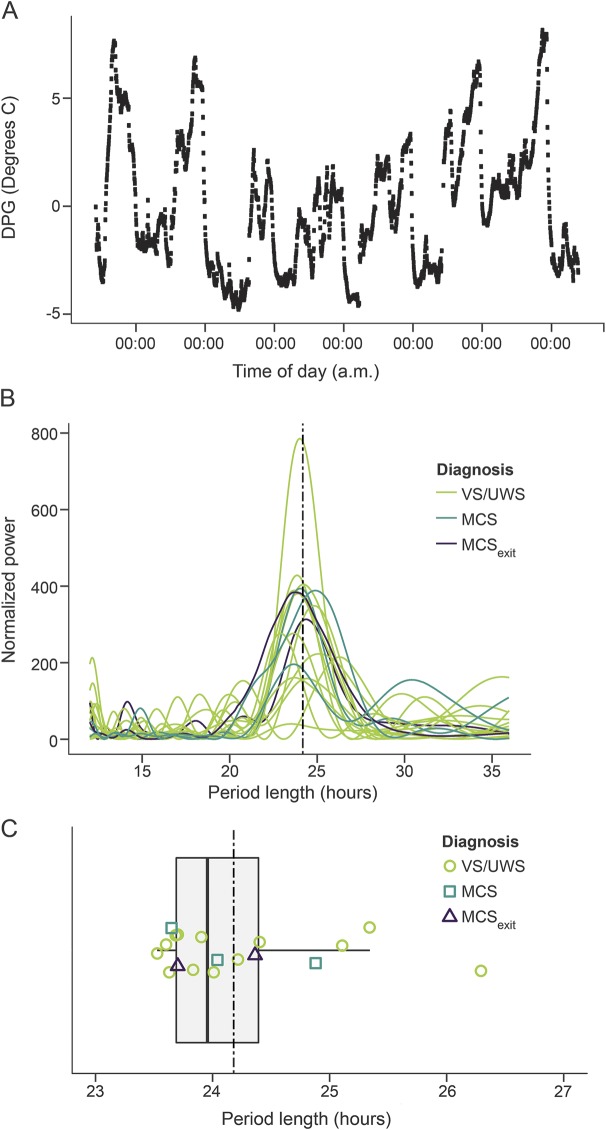
Figure 1. Skin temperature variations, Lomb-Scargle periodogram results, and boxplot of period lengths of circadian rhythms.
(A) Skin temperature variations. Example data from one patient (P01) show variations in the distal–proximal skin temperature gradient (DPG) across approximately 7 days. (B) Lomb-Scargle periodogram results. This plot shows the results of the Lomb-Scargle periodogram analysis for all participants. The x-axis shows the period length in hours, the y-axis shows the normalized power (arbitrary units). The dashed vertical line indicates 24.18 hours. (C) Boxplot of period lengths of circadian rhythms. The dashed vertical line indicates 24.18 hours, i.e., the supposedly ideal period length reported in well-controlled studies on healthy individuals. The box shows the quartiles, the vertical line in the box represents the median. Whiskers of the boxplot indicate the 1st and 3rd quartile ±1.5 times the interquartile difference. Note that all patients show a circadian temperature rhythm. MCS = minimally conscious state; UWS = unresponsive wakefulness syndrome; VS = vegetative state.

