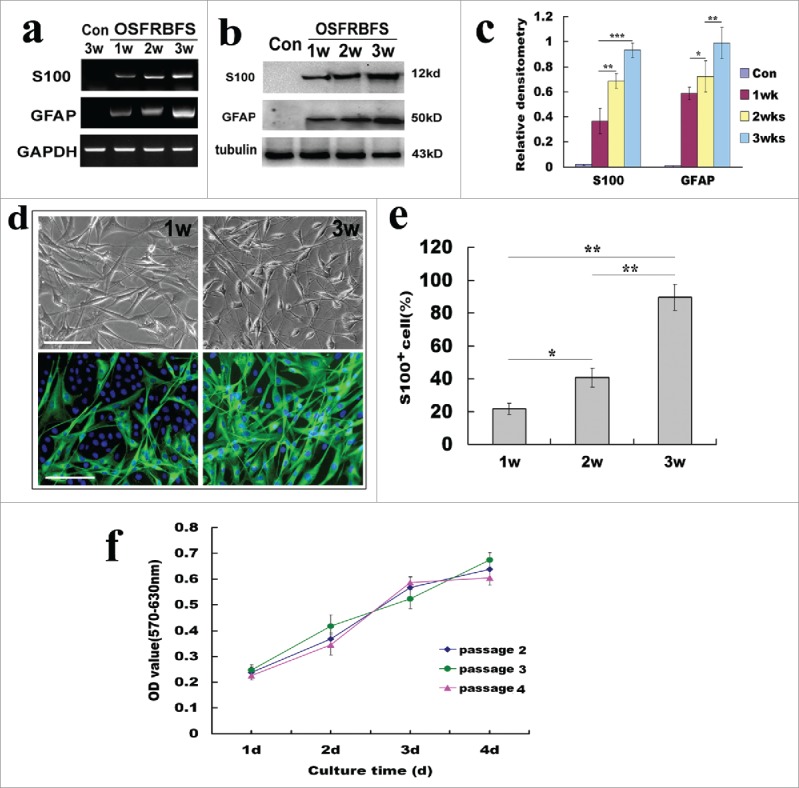
Figure 6.

Optimal induction for efficiency of the conversion of ADSCs to SCs. (A, B) Reverse transcription PCR and western blots showed the changes of SC phenotypic markers S100 and GFAP at gene and protein levels under the optimal induction. GAPDH and β-Action served as loading control of RNA or total protein, respectively. (C) Quantification of SC marker expression during differentiation of ADSCs at different induction stages. Notably, the expression levels 2 molcules in ADSCs induced with OSFRBFS show a significant time-dependent upregulation. (D) Immunofluorescence images of differentiated ADSCs stained with S100 at 1–3 weeks. Notably, the images of induced ADSCs with OSFRBFS for 2 weeks were not shown because of no significant difference with 1 week. (E) Percentages of S100 positive cells after induction within 3 weeks. (F) The change of proliferative capacity of the convert cells from different passages with longer culture time. All data are reported as mean ± SEM. *p<0.05 compared with the relevant controls; **p<0.01; and **p<0.001. Scale bars = 100 μm
