
Figure 2.
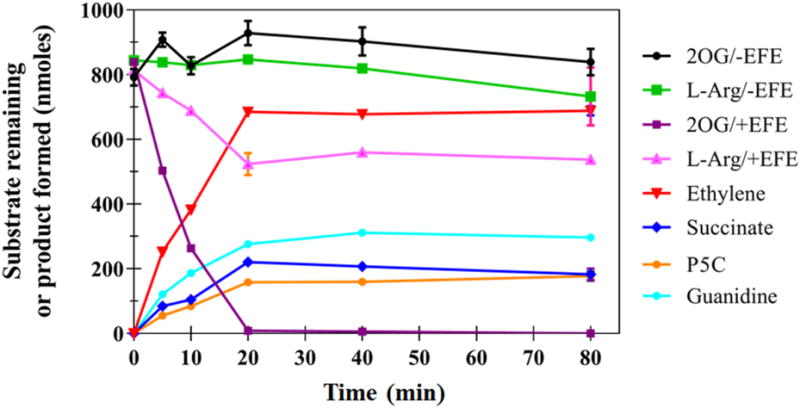
Representative time course of the EFE enzymatic reaction showing product formation and remaining substrates. The 2 mL reaction mixture consisted of 252 nM EFE, 0.5 mM 2OG, 0.5 mM L-Arg, 0.2 mM Fe(II), and 0.4 mM L-ascorbic acid in 10 mM NH4HCO3, pH 7.5 at 25 °C. Error bars represent the standard errors for n = 2.